EXPERIMENT NO - 2
ARVIND KUMAR
clc;
clear all;
close all;
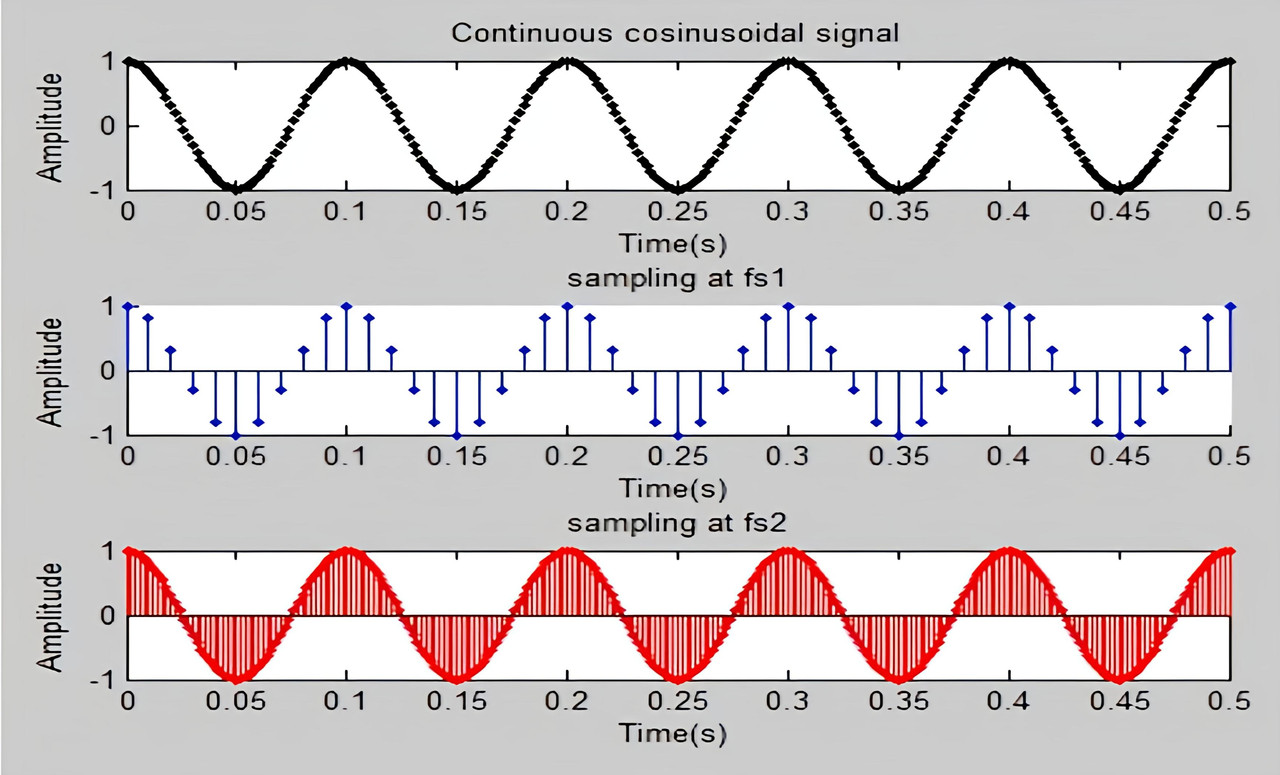
fs=500;
f=10;
N=5;
t=0:1/fs:N*1/f;
x=cos(2*pi*f*t);
subplot(3,1,1);
plot(t,x,'.r');
title('Continuous sinusoidal signal');
xlabel('Time(s)');
ylabel('Amplitude');
fs1=100;
t1=0:1/fs1:N*1/f;
x1=cos(2*pi*f*t1);
subplot(3,1,2);
hold on;
stem(t1,x1,'.g')
xlabel('Time(s)');
ylabel('Amplitude');
title('sampling at fs1');
fs2=500;
t2=0:1/fs2:N*1/f;
x2=cos(2*pi*f*t2);
subplot(3,1,3);
plot(t,x);
hold on;
stem(t2,x2,'.b');
xlabel('Time(s)');
ylabel('Amplitude');
title('sampling at fs2');
WAVEFORMS