EXPERIMENT NO - 3
clc;
clear all;
close all;
n=-20:50;
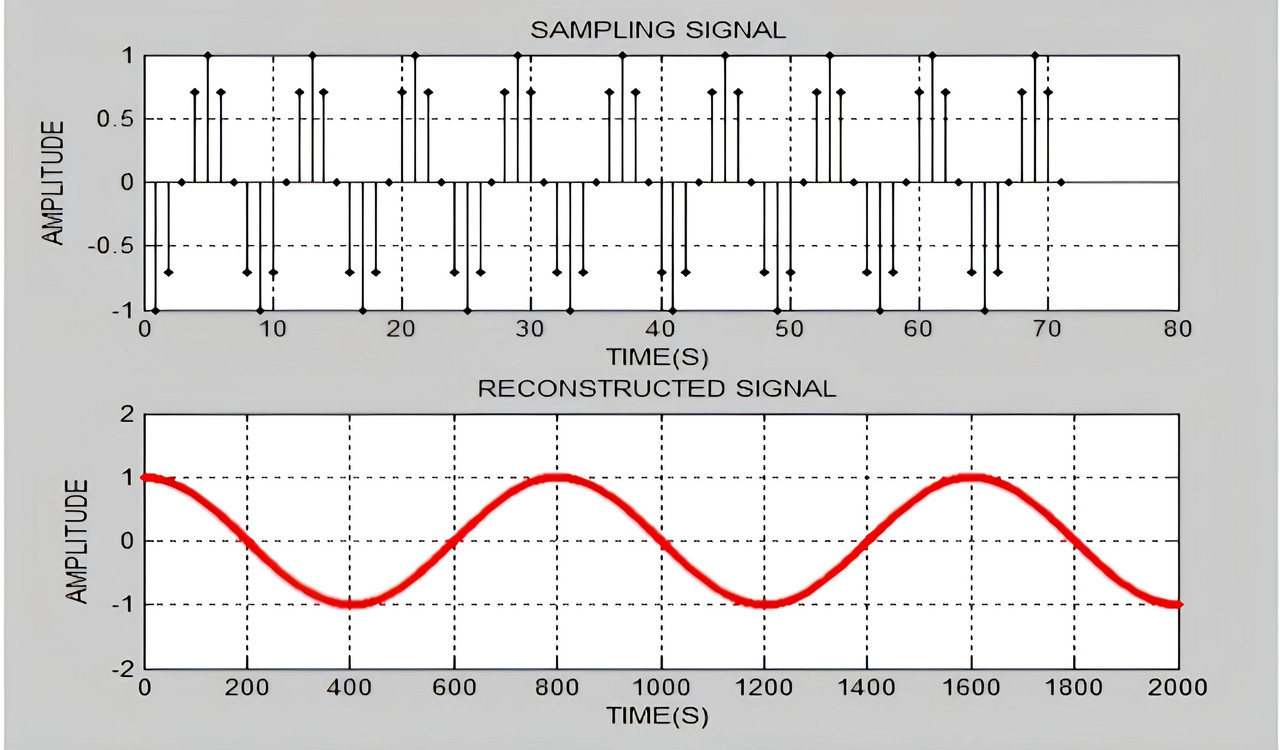
x=cos(pi.*n./4);
subplot(2,1,1);
stem(x,'.k');
xlabel('TIME(S)');
ylabel('AMPLITUDE');
title('SAMPLING SIGNAL');
grid on
box on
T=1/1000;
for i=1:2000;
t=(i-1)*T/100;
h=sinc((t-n.*T)./T);
xr(i)=x*h.';
end
subplot(2,1,2);
plot(xr,'.r');
title('RECONSTRUCTED SIGNAL');
xlabel('TIME(S)');
ylabel('AMPLITUDE');
grid on
box on
WAVEFORM